Research Group
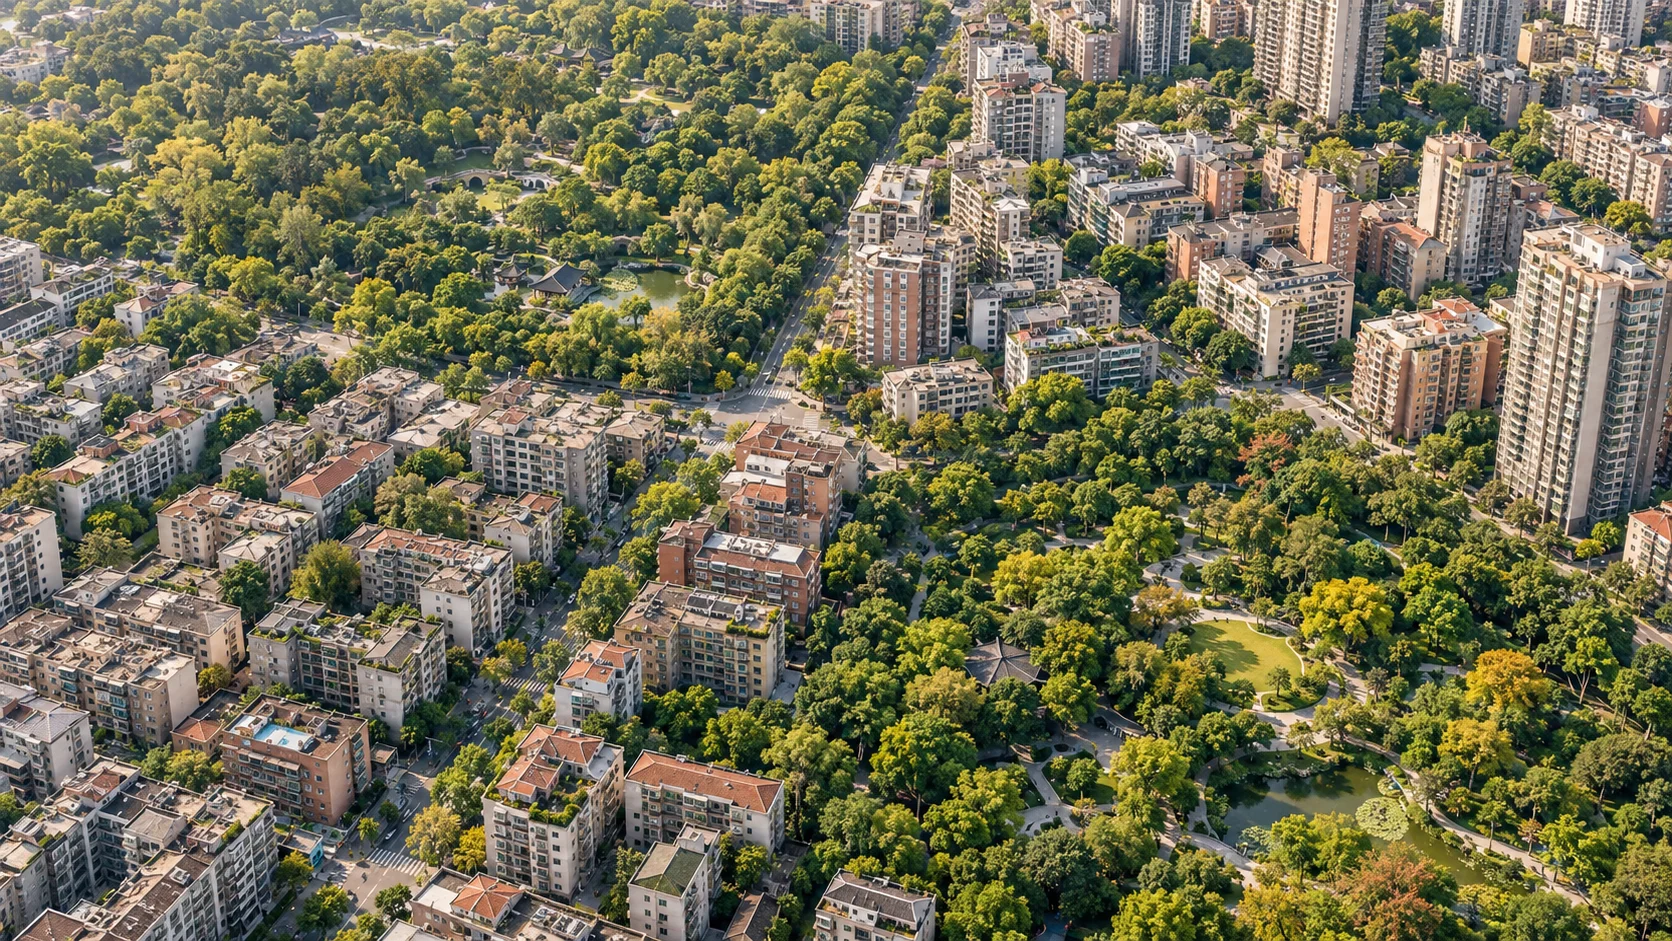
Urban greenspace / Environmental inequality
A green city.
For whom?
A city can be green on a map.
That does not mean everyone
experiences it equally.
01 / Count people, not only green pixels
What a city has.
What people experience.
Green coverage describes the land. Population-weighted exposure describes the green environments around people’s locations. Across the cities studied, these told very different stories.
Greenspace coverage
The share of urban land covered by vegetation
Population-weighted exposure
Green coverage around people’s locations
Means across 303 cities · whole-day exposure · 2016 data Fig. 3 / Study results
02 / Look beyond the average
The same average.
A different lived environment.
Exposure can be shared relatively evenly, or concentrated among a few. Move the slider to see why a citywide average cannot describe that difference.
100 people. One unchanged average.
Illustrative example, not observations from the paper. Exposure is expressed in relative units; the population and total exposure remain fixed.
03 / What we observed in China
Inequality was
the widespread pattern.
Cities had a whole-day
exposure Gini above 0.6.
About two in three cities fell into the study’s high or very high inequality categories.
One dot = one city. Grouped by threshold, not by geography.
Uneven across regions, too
Local context
matters.
Higher regional mean inequality was observed in northern and northwestern cities. The study linked exposure inequality with greenspace provision and geo-climatic conditions.
These are associations, not estimates of causal effects.
The same city, at a different time
People move.
Inequality changes.
Greenspace stays in place, but the population around it changes. In Daxinganling, exposure inequality was higher during the day than at night.
This is one city’s reported result, not a rule for every city.Reported results from the paper Sections 3.2–3.4 / Full analysis
The planning question
More green.
Within more people’s reach.
Greening targets need to consider where people are, how exposure is distributed, and what local conditions allow. Quantity matters. So do location, quality and people’s needs.
Sentinel-2 imagery estimates vegetation within urban areas.
Aggregated Tencent location data capture daytime, nighttime and whole-day distributions.
Population-weighted exposure and the Gini index reveal unequal exposure.
The study measures ambient vegetation around population-grid locations, not individual park visits or personal health outcomes. It uses 2016 observations and was published in 2021.
The research
Observed inequality in urban
greenspace exposure in China
Yimeng Song, Bin Chen, Hung Chak Ho, Mei-Po Kwan,
Dong Liu and colleagues